Find what's slowing your site. Fix it in minutes.
Joltsite shows you the exact scripts, DOM elements, and pages dragging your Core Web Vitals down. Stop guessing why your LCP is slow. See the specific third-party script or image causing it.
Plans from €9.99/mo excl. VAT, every feature included on every plan
You know your Core Web Vitals need work.
But where do you start?
PageSpeed Insights tells you your LCP is 4.2s. Great. But it doesn't tell you which script is blocking render, which image loads too late, or which element shifts on mobile. You end up spending weeks A/B testing assumptions instead of fixing the actual problem.
53%
of visits abandoned if a mobile page takes over 3s to load
~60%
of websites lack enough traffic for CrUX field data
Hours
to identify and fix your worst bottleneck with the right data
From "my site is slow" to "here's exactly why"
Drop a lightweight RUM snippet onto your site and get page-level, element-level debugging in minutes.
Add the snippet
Drop our 2KB RUM script onto your site. No sampling, no aggregation — real metrics from real visitors on every page load. No cookies, no PII, GDPR-friendly by design.
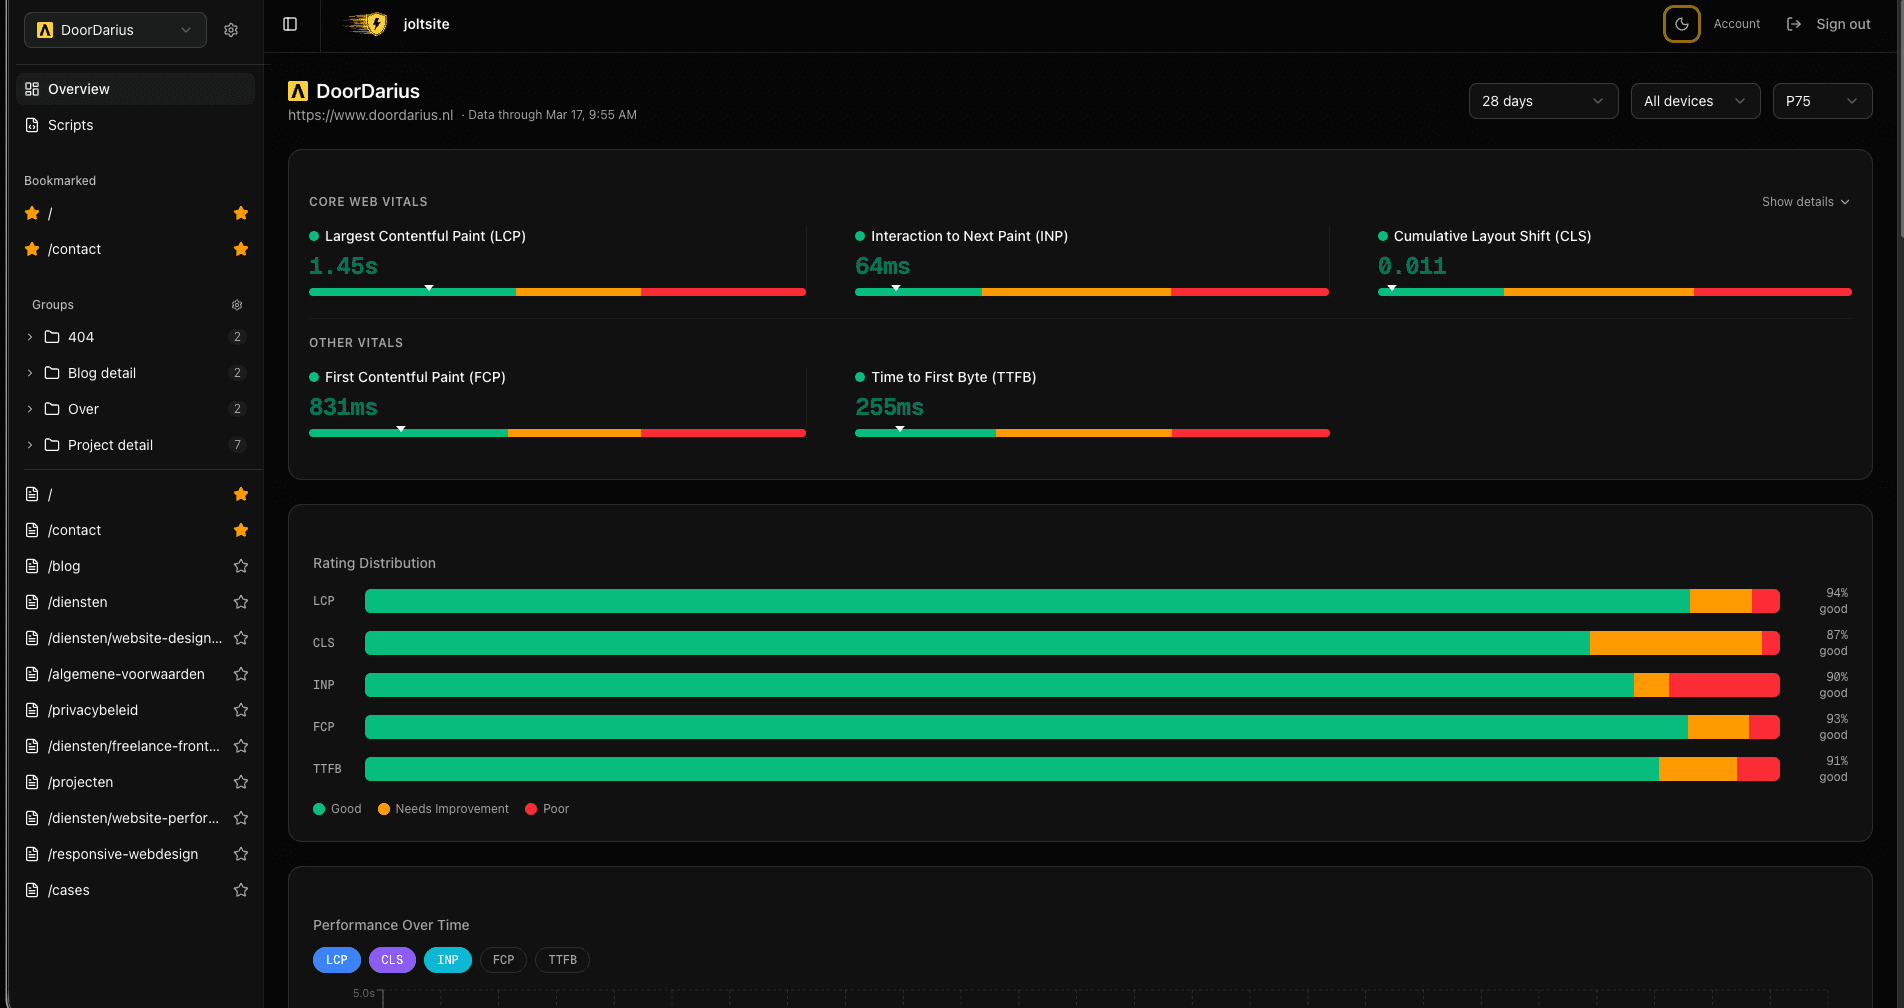
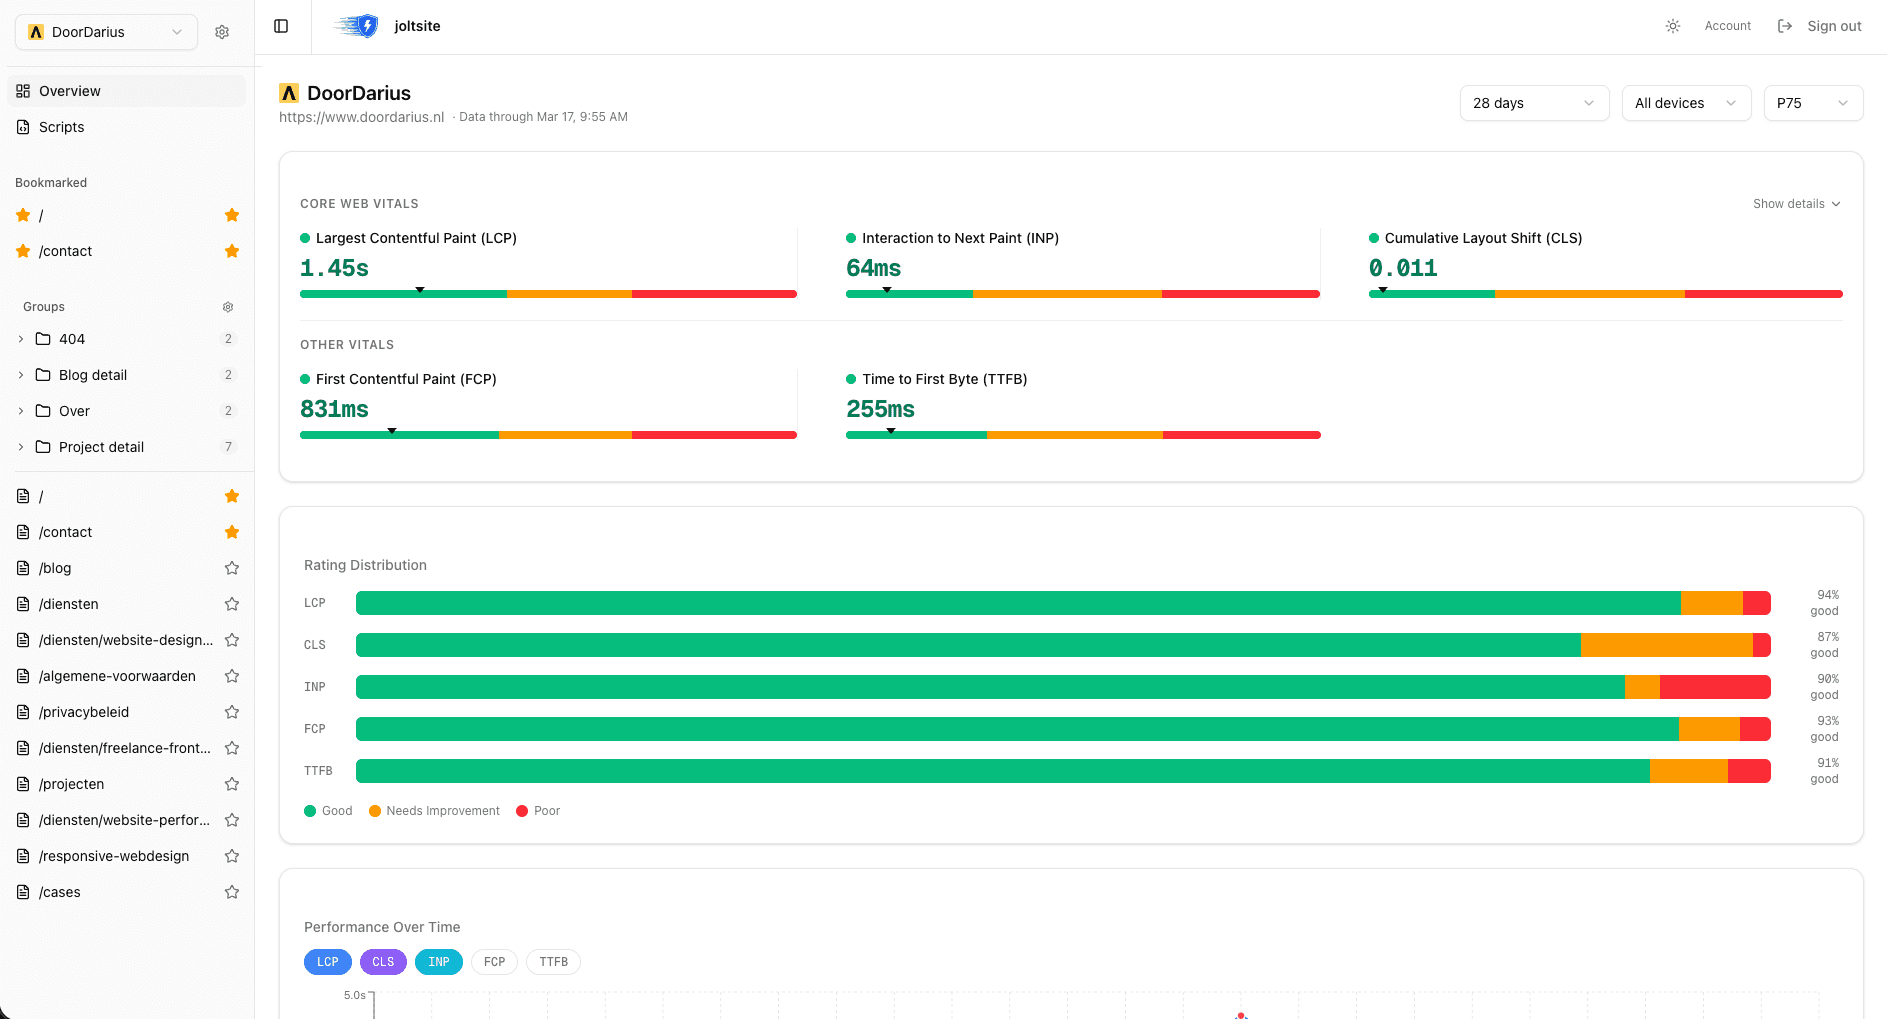
See what's broken
Drill into per-page metrics. See which DOM element is your LCP target, which element triggered a layout shift, which interaction had the worst INP. Filter by device, percentile (P75/P90/P95/P99), and time range.
Fix and verify
Use the script analysis to find third-party JavaScript correlated with poor scores. Remove or defer the offending script, deploy, and watch your metrics turn green in the time-series chart.
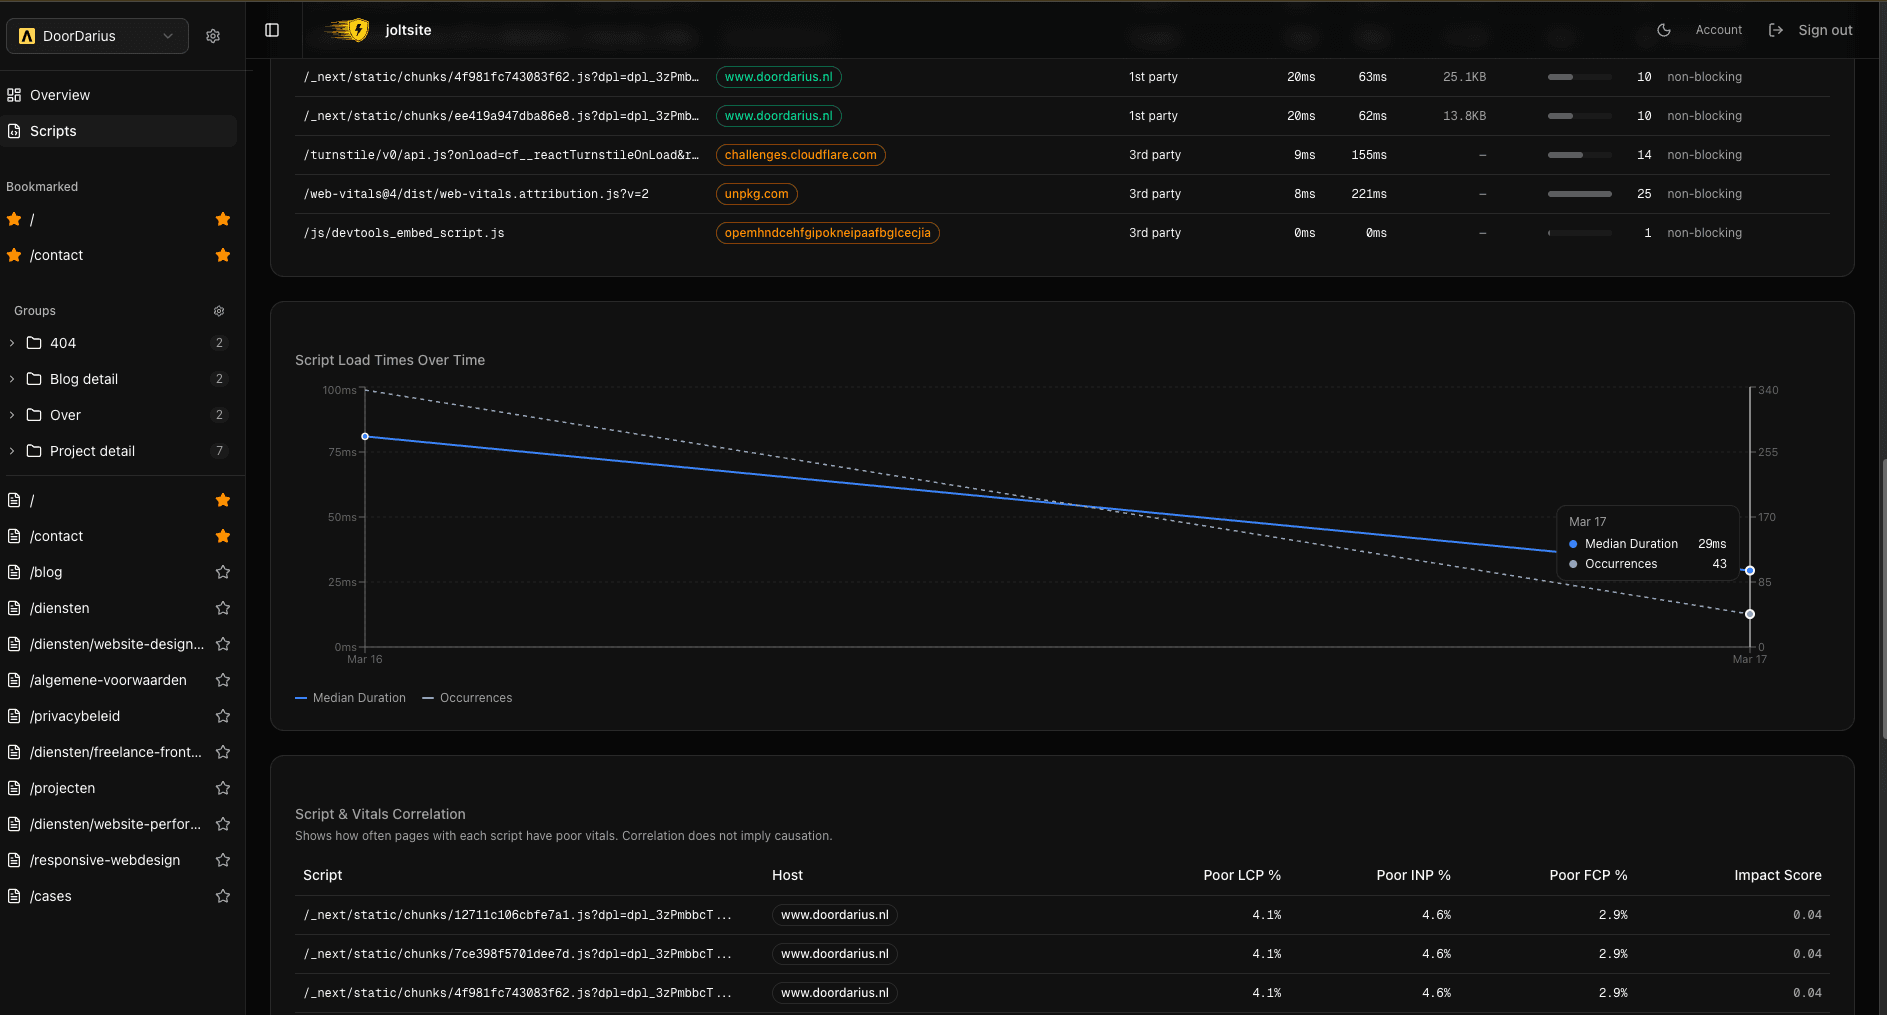
Script analysis shows exactly which JavaScript is dragging your vitals down
Built for debugging, not just dashboards
Most monitoring tools give you a score and leave you to figure out the rest. Joltsite traces each poor metric back to a specific element or script.
div.hero-banner shifted 47 times on mobile with a P75 of 0.18". Each element shows occurrence count, percentile values, and rating distribution./checkout has a 6s LCP on mobile. Create URL groups with pattern matching (e.g. /products/*) to track aggregate performance across any route set.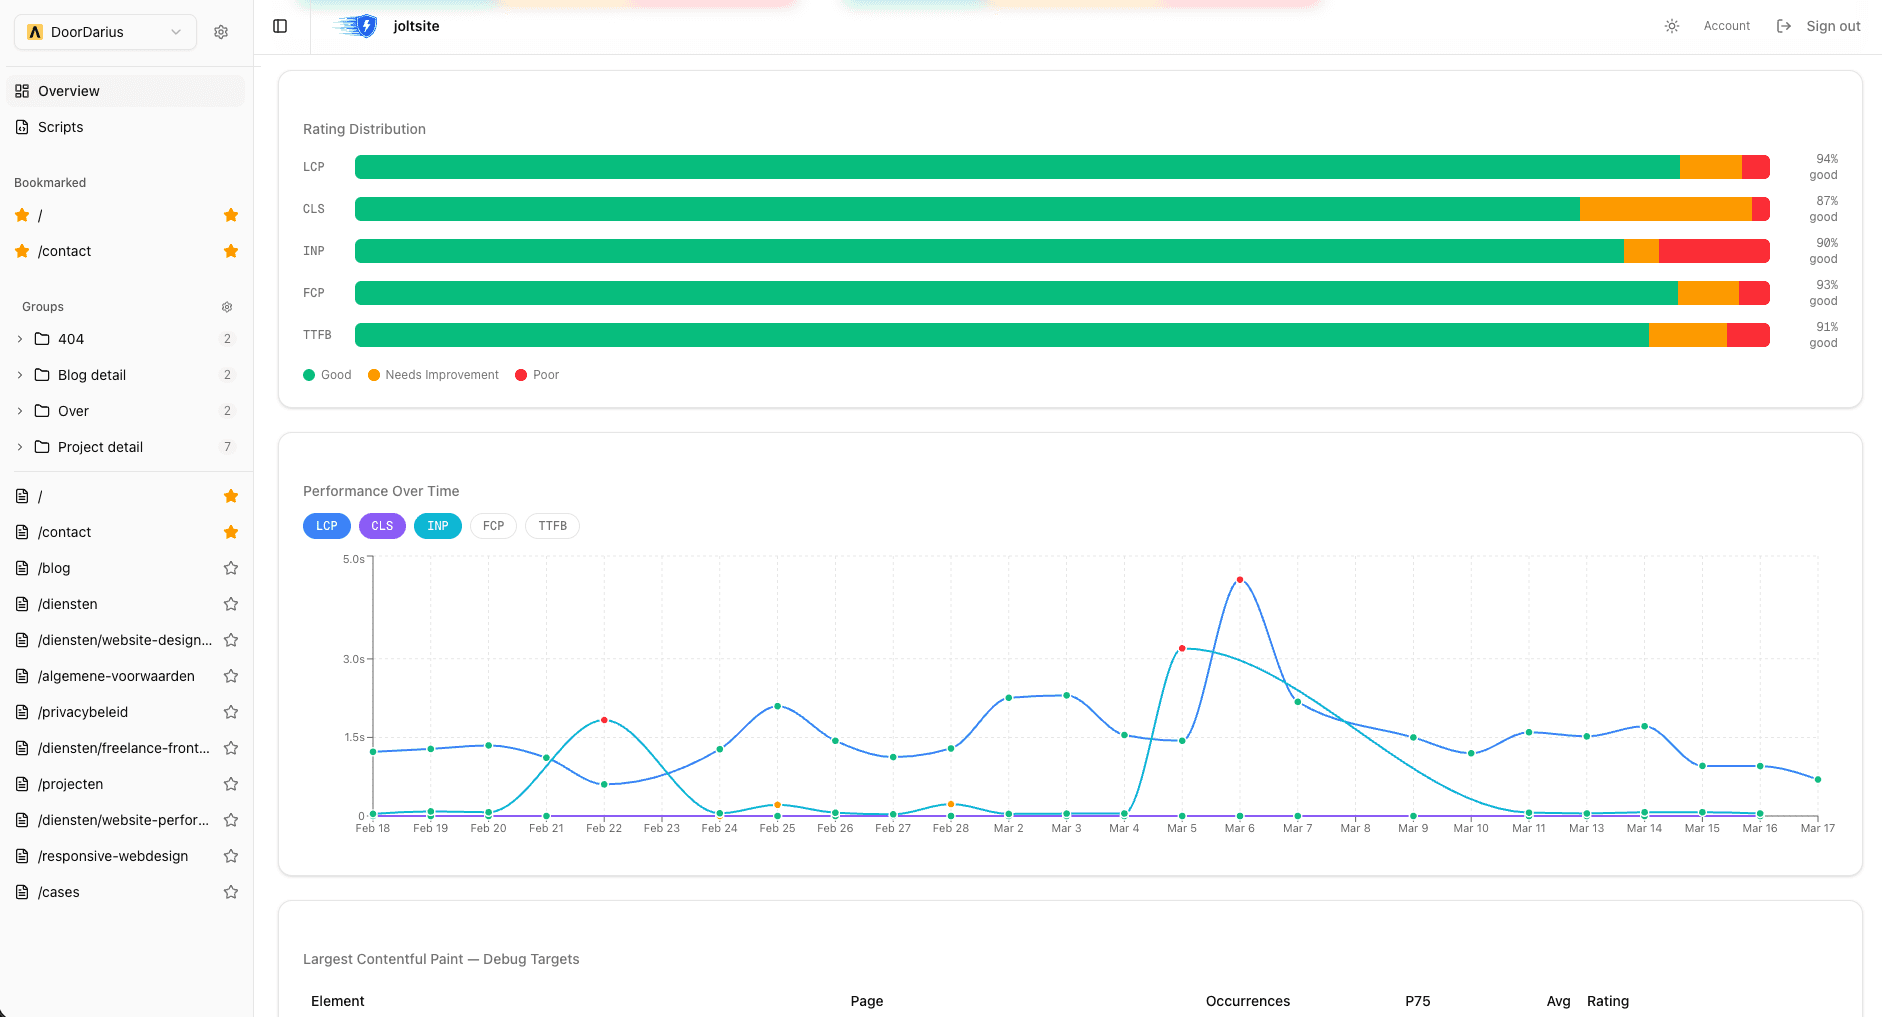
Track how your vitals change over time and spot regressions the day they happen
Your AI agent, powered by real field data
Ask questions in plain language. Joltsite's MCP server gives your AI agent direct access to your Core Web Vitals — no dashboards needed.
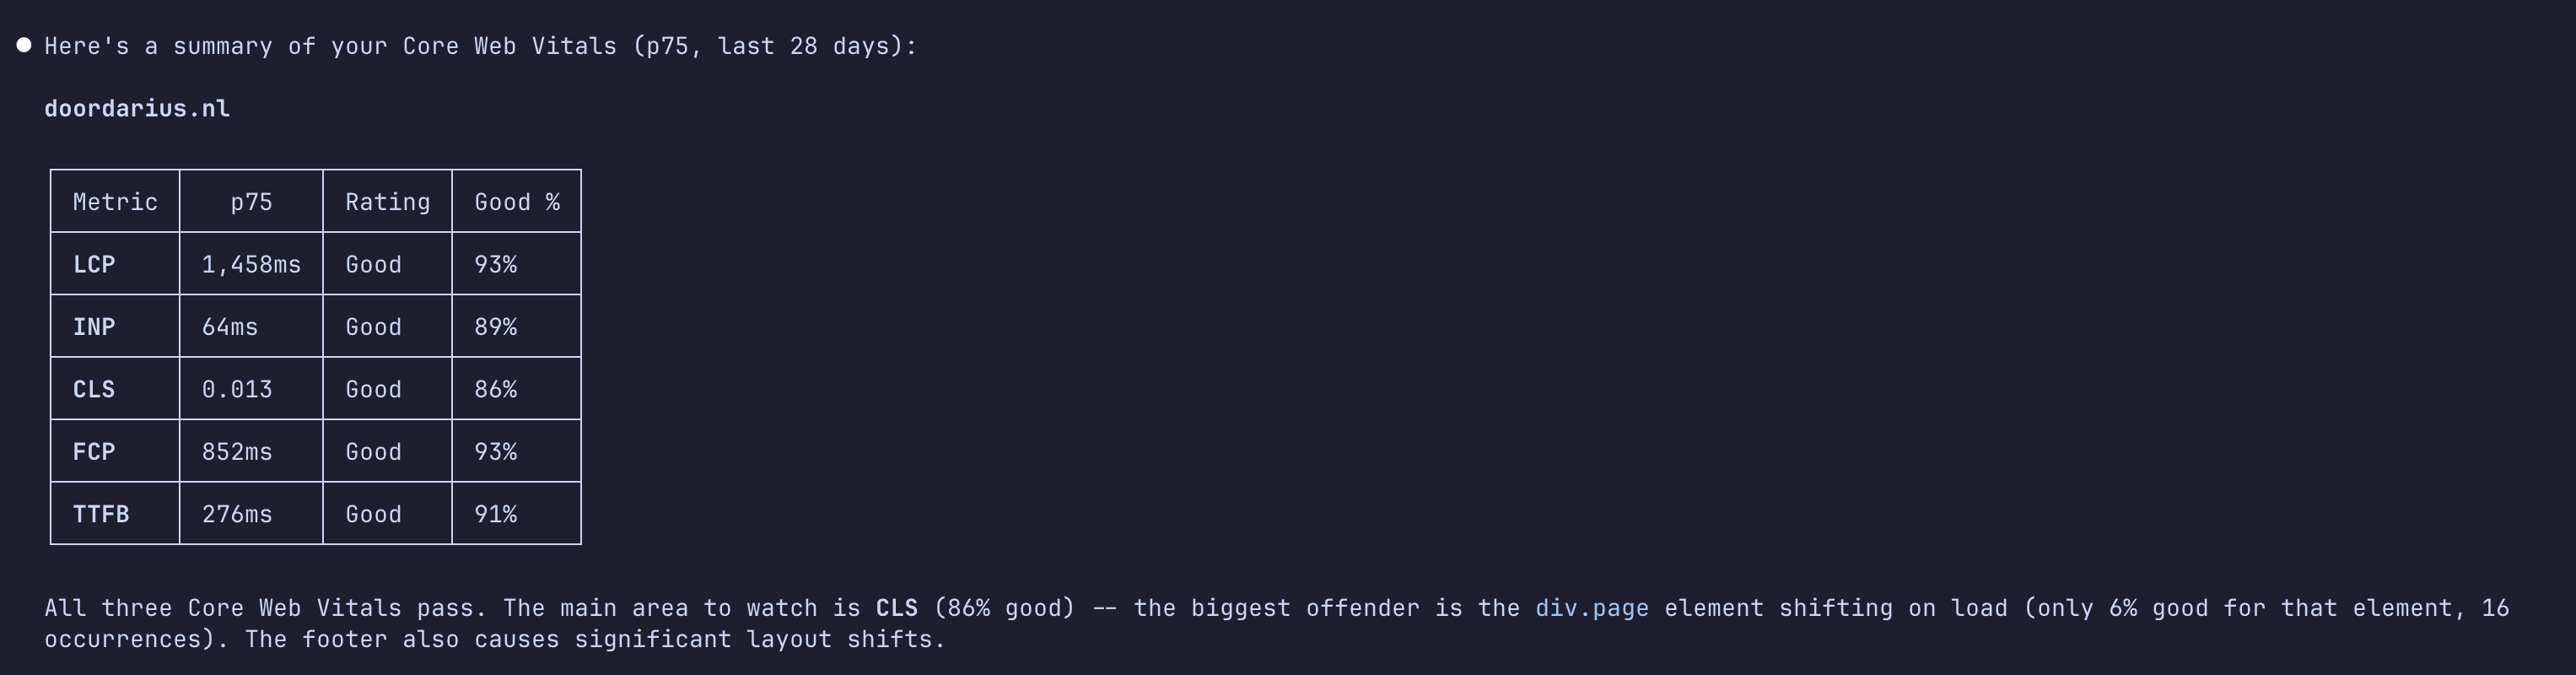
Get a complete vitals summary with ratings and percentiles
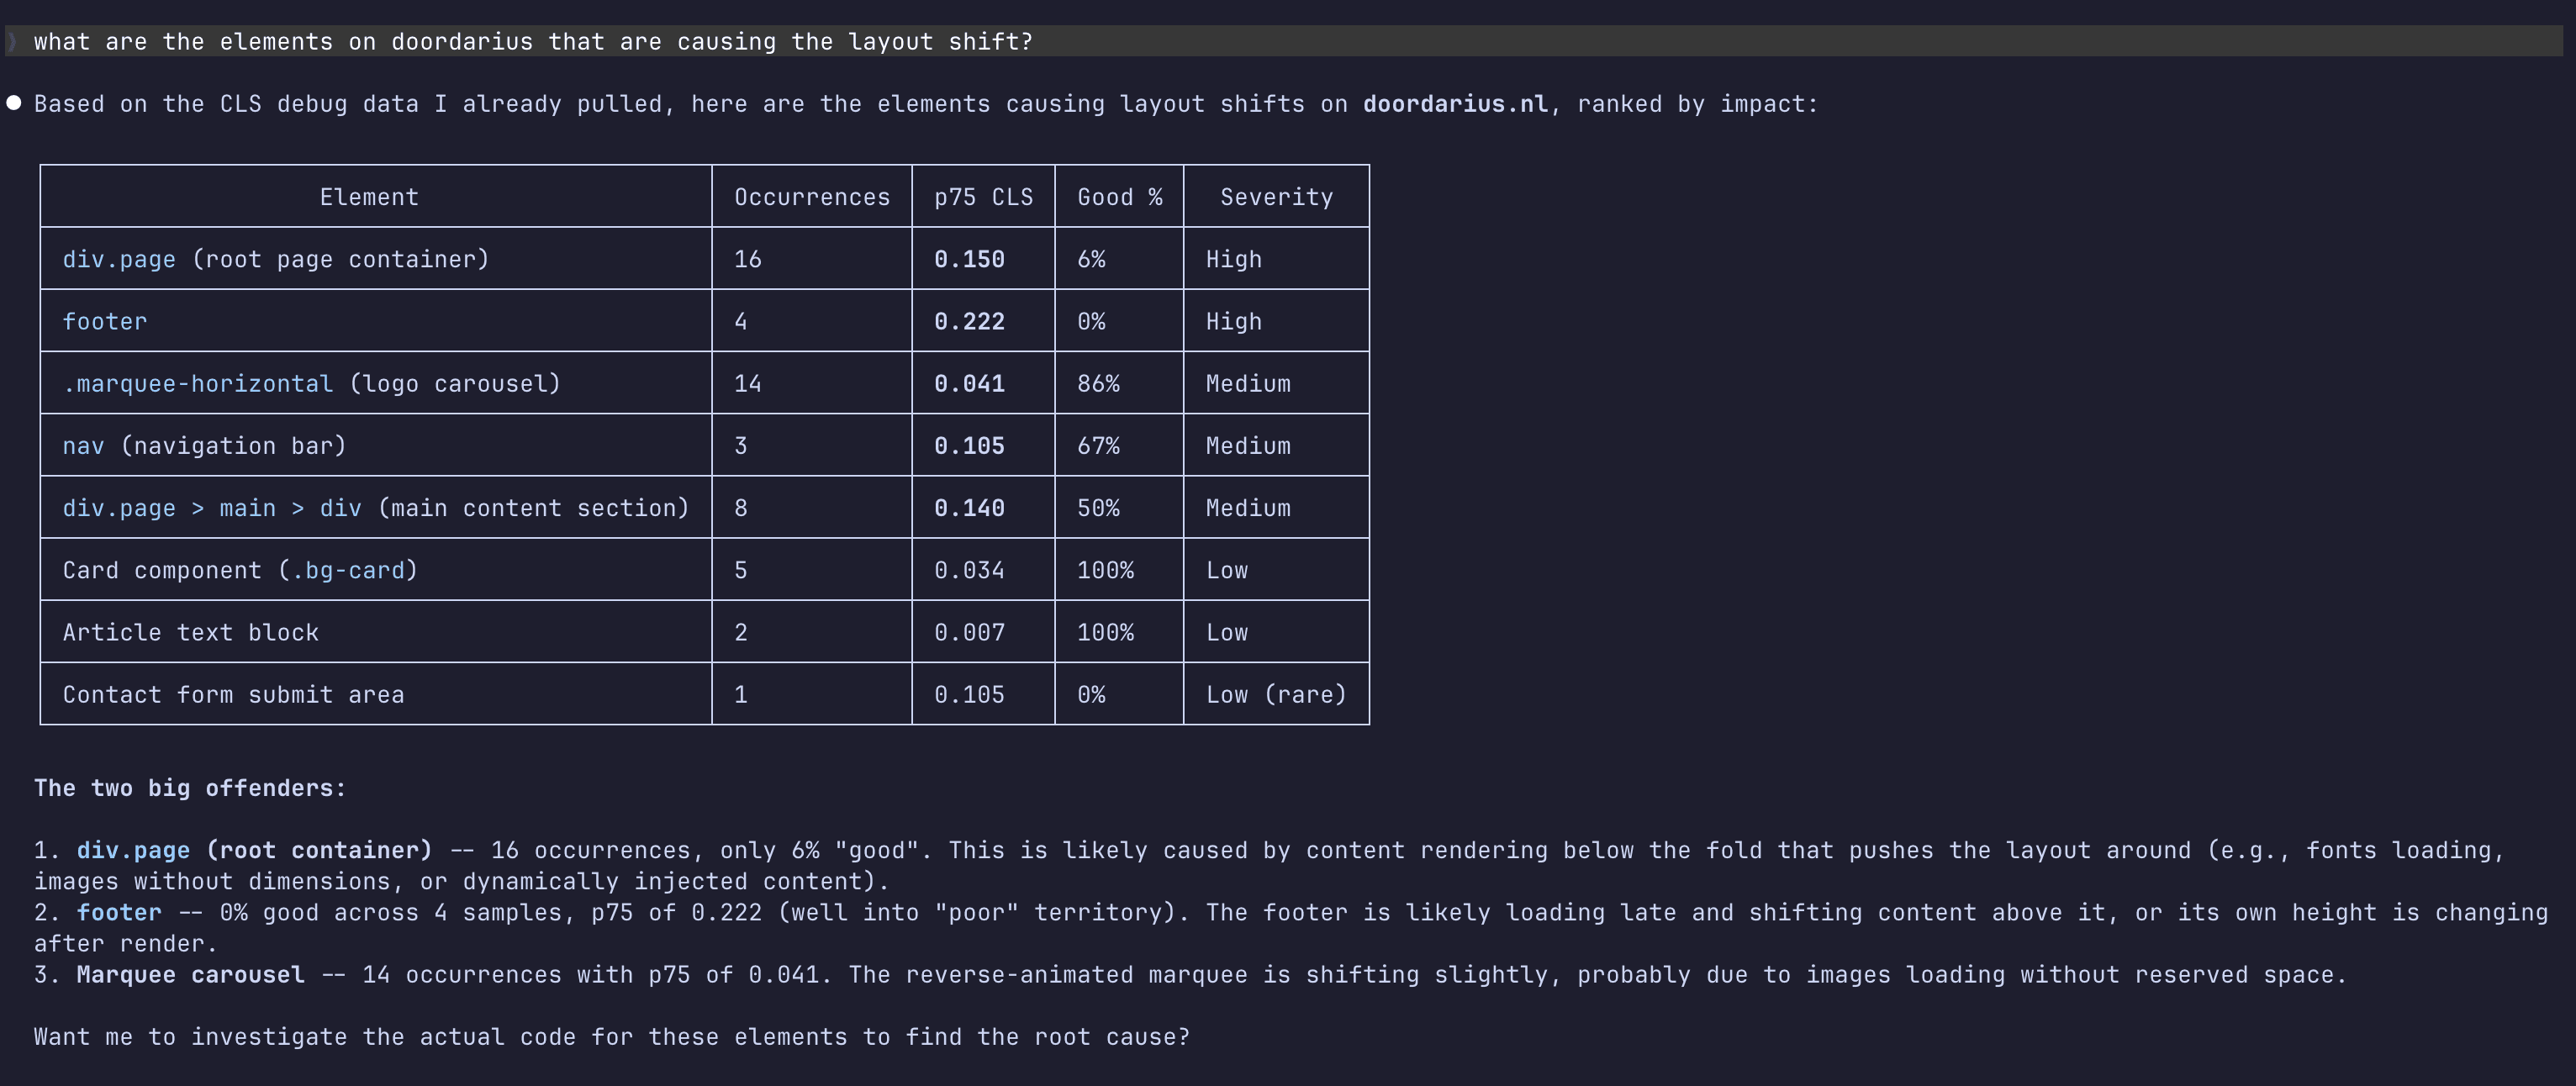
Debug layout shifts down to the exact DOM element causing them
Pricing that doesn't punish small sites
Every plan includes every feature. No paywalled metrics, no "upgrade to see debug data". You only pay for volume.
excl. VAT
- 50K pageviews/mo
- 2 websites
- Script impact analysis
- Debug elements (LCP, CLS, INP)
- URL groups & page drill-downs
- MCP server access
excl. VAT
- 500K pageviews/mo
- 5 websites
- Script impact analysis
- Debug elements (LCP, CLS, INP)
- URL groups & page drill-downs
- MCP server access
excl. VAT
- 1.5M pageviews/mo
- 10 websites
- Script impact analysis
- Debug elements (LCP, CLS, INP)
- URL groups & page drill-downs
- MCP server access
Need more? Add to any plan:
All prices are excluding VAT
Your next deploy could fix your worst metric
Most performance work stalls because teams can't pinpoint the cause. Joltsite shows you the exact script, element, or page to fix, so your next deploy actually moves the needle.
Start monitoring nowPlans from €9.99/mo excl. VAT, every feature included